What mastery measurement actually measures
Most “mastery” dashboards measure compliance with a sequence. The difference between measuring a sequence and measuring a claim changes what you build.
Read the essayLearning scientist · Curriculum engineer — Santiago, Chile
We use mathematics and AI to read the real systems of the planet and turn them into living learning, not isolated exercises. I work at the seam where psychometrics, data mining, curriculum, and product meet.
Read the manifesto
No one designed the school.
Everyone pushed it.
The school as we know it was not designed: it was the point where the State, the factory, the church, and the empire converged. Two hundred years later, we still teach inside that form — and in no discipline does it show more than in mathematics.
AI can take over the procedural — the algorithm, the technique, the practice that builds fluency — until mastery on any standardized test takes the least time possible. Let the test stop being the center and become a formality: let us break it by saturation, with everyone answering at a level where it can no longer stratify anyone.
And then the classroom is free for what no machine can answer: understanding why, and imagining solutions to water scarcity.
Challenging comfortable premises isn't for everyone. If you're ready to build what's next, start here.
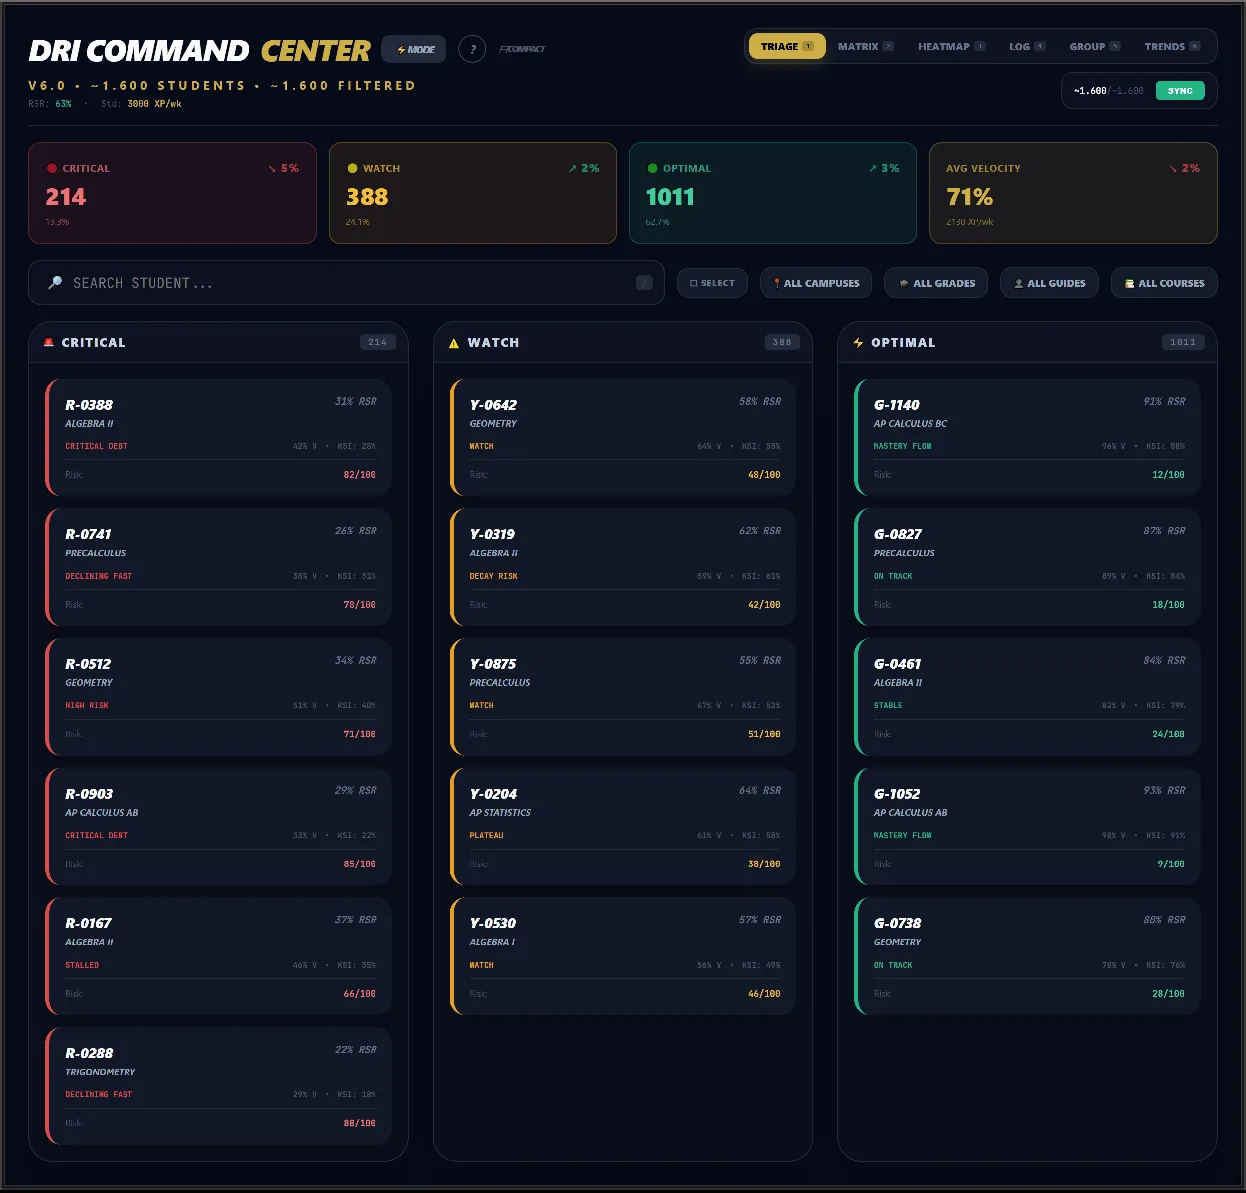
Academic risk in real time for ~1,600 students. Triage view, student matrix, and heatmap over live platform data.
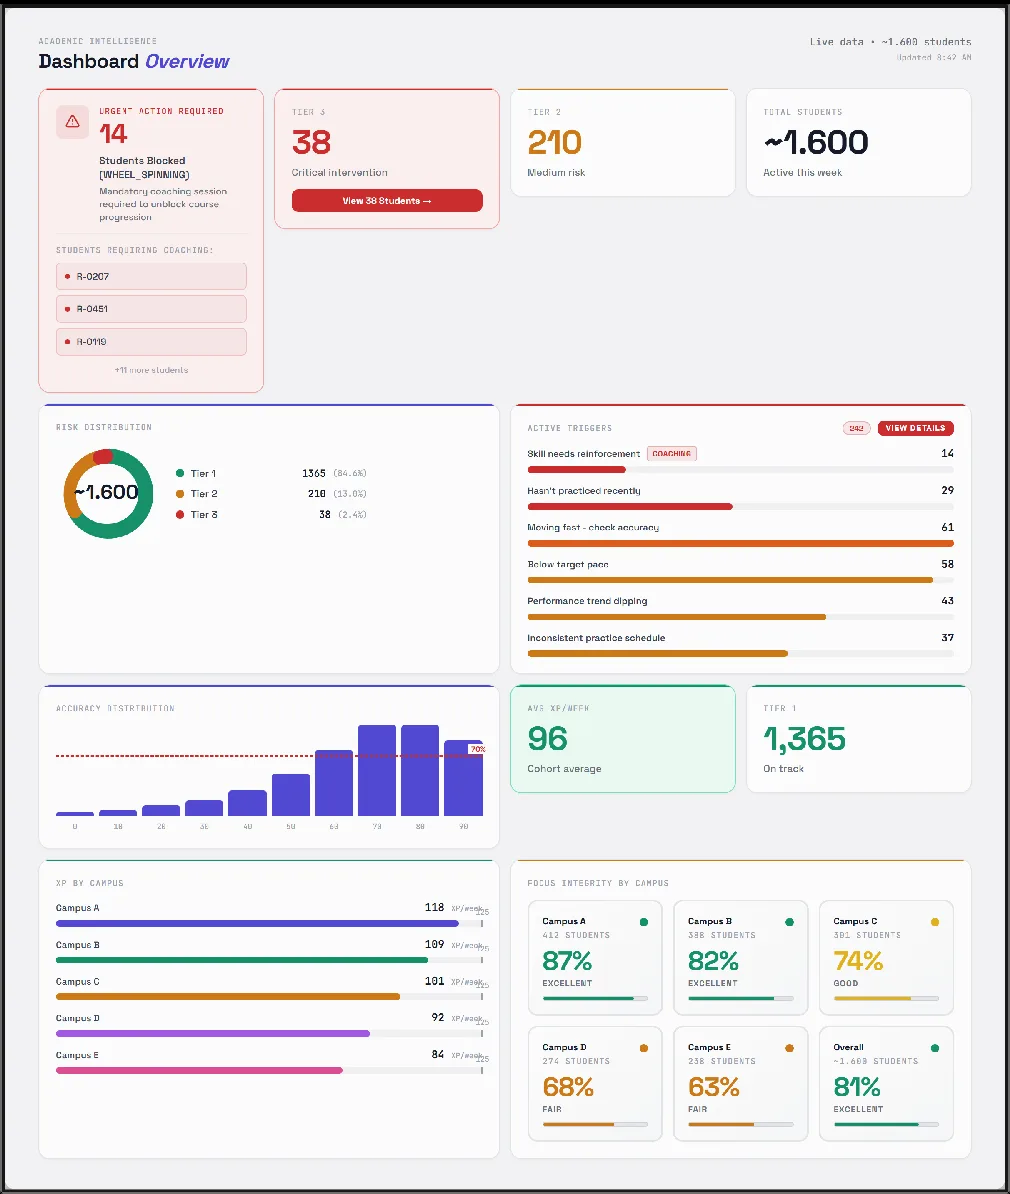
Morning Coffee dashboard: risk-tier KPI tiles, student timelines, and early-intervention pattern detection.
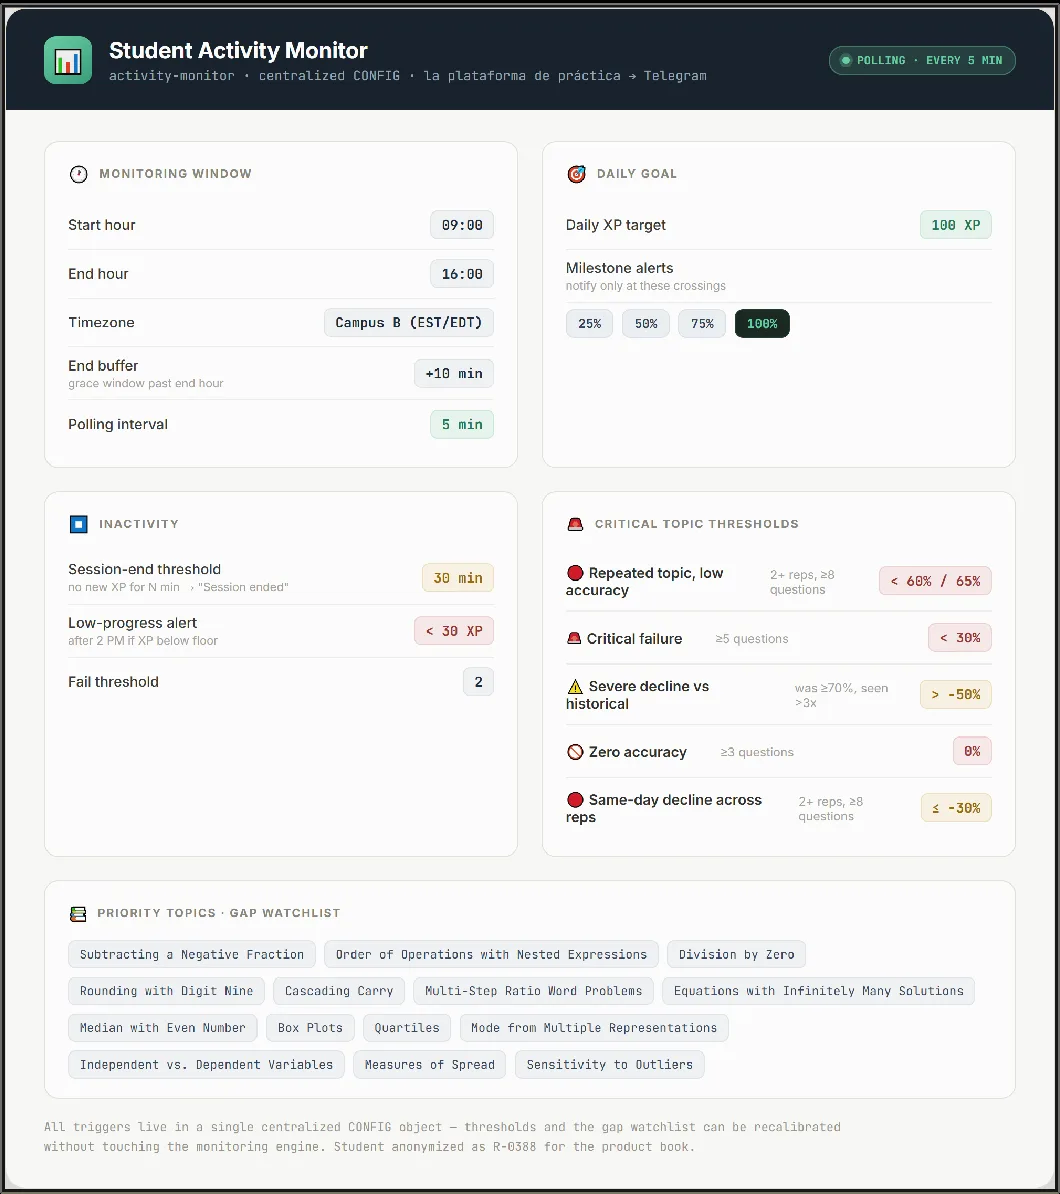
Bot that watches learning pace every 5 min and sends only the signals worth acting on via Telegram.
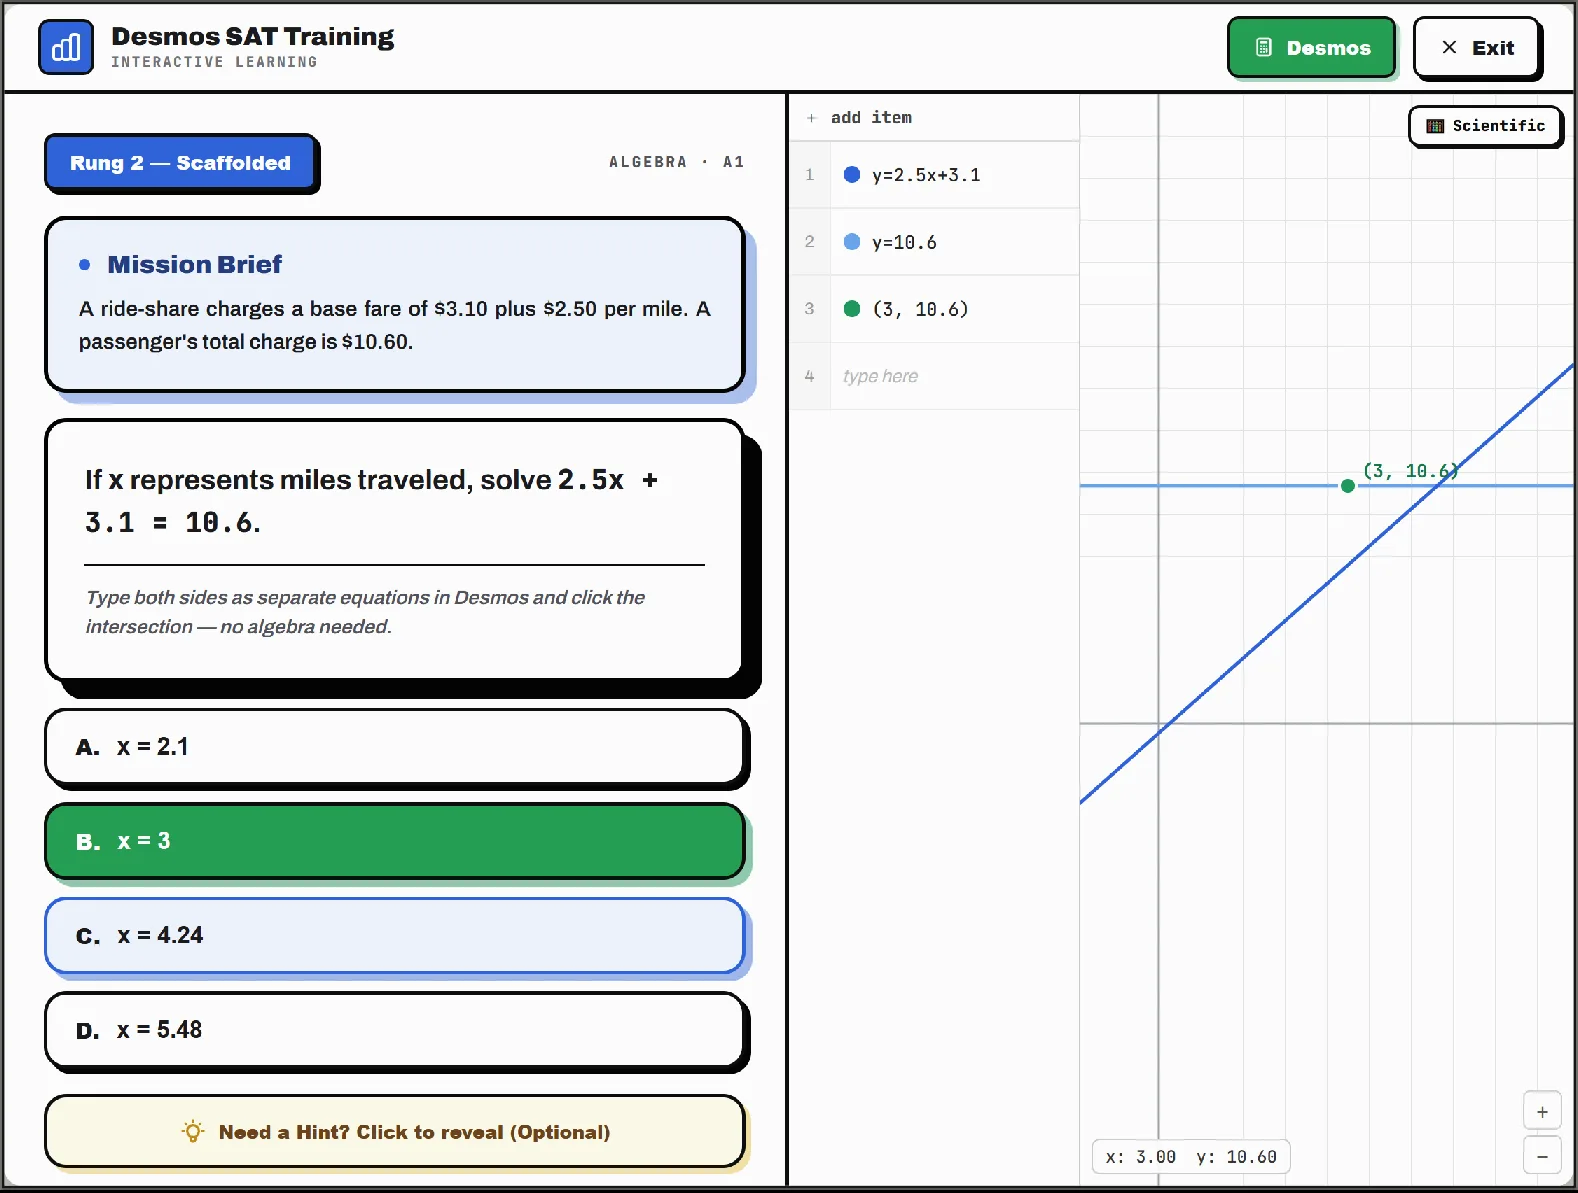
Calculator mastery for the 650→800 leap. Split view: SAT prompt on the left, live Desmos always co-visible.
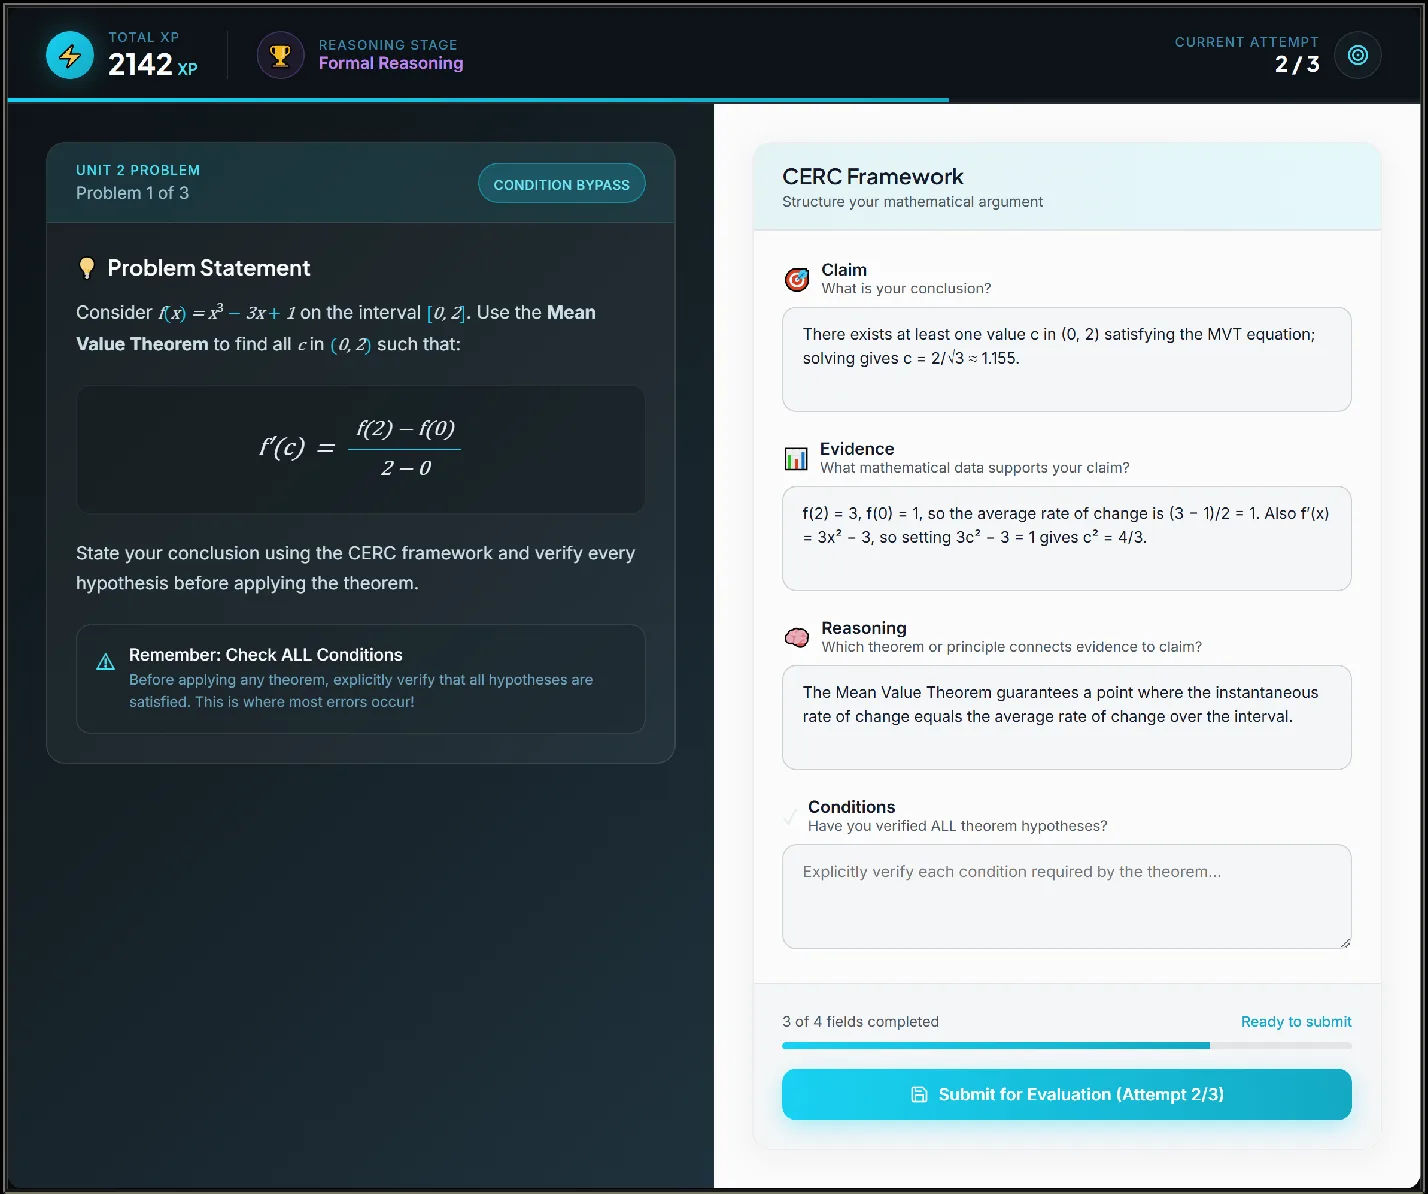
CERC framework for the 3→5 AP gap. Completeness scoring — structural integrity before eloquence.
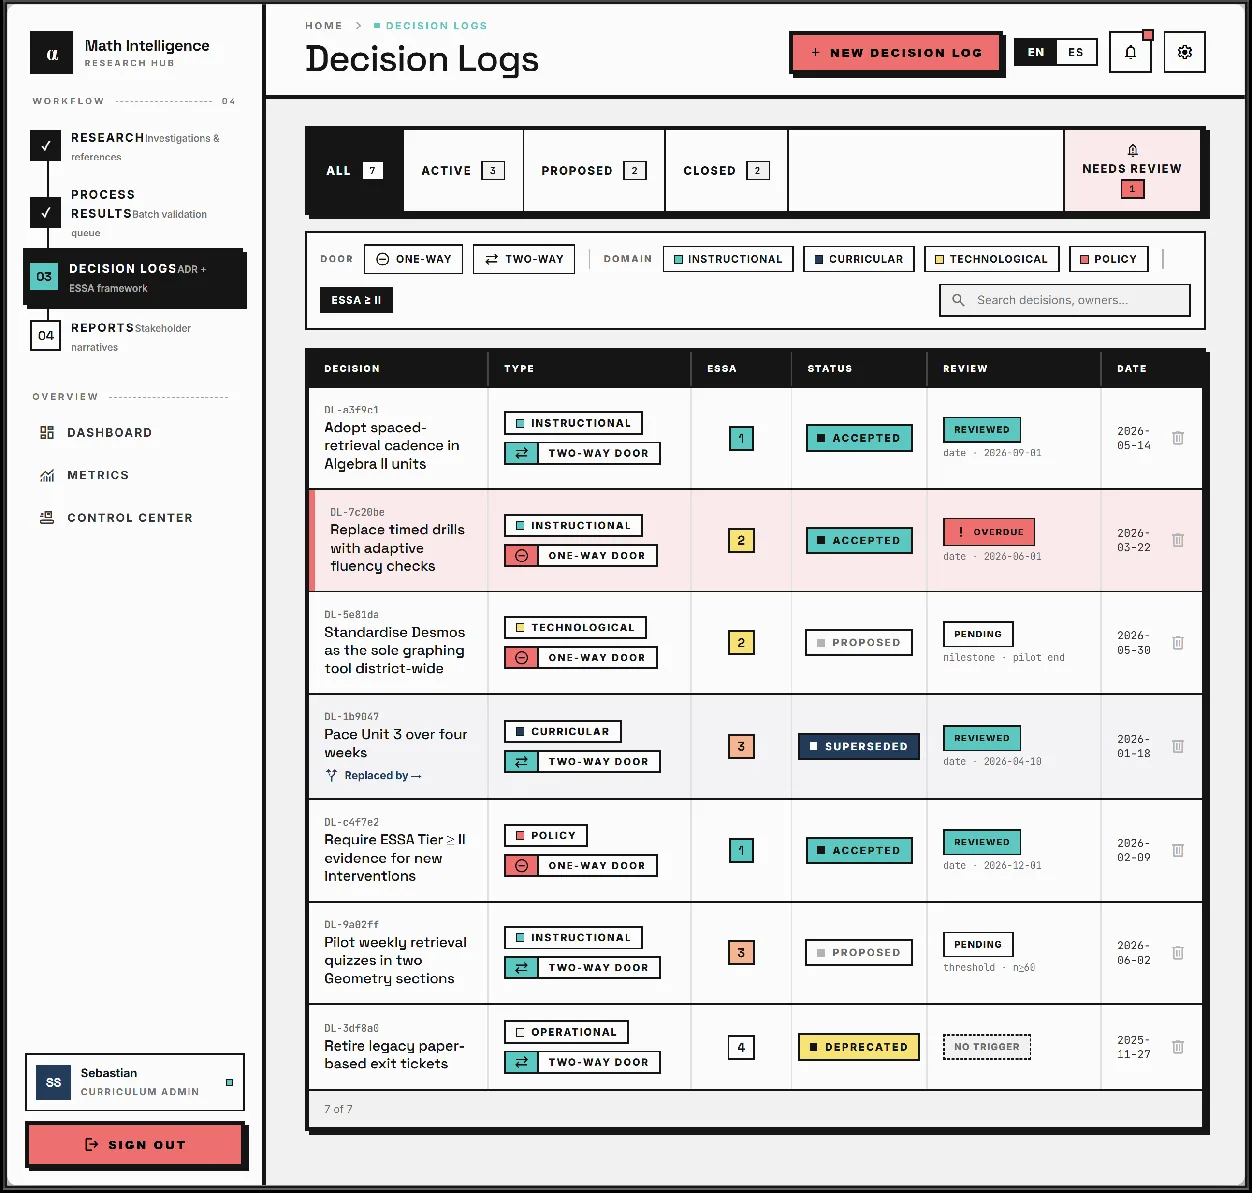
Nine-stage evidence pipeline. Every published conclusion has claim-level traceability to its source study.
In production: a bank of 700+ verified items generated with an AI pipeline and automated quality gates · 19 studies classified by ESSA evidence levels (I–IV) · item design and validation for the national university admission system · IB MYP mathematics leadership · work presented at ISTELive 25.
Most “mastery” dashboards measure compliance with a sequence. The difference between measuring a sequence and measuring a claim changes what you build.
Read the essayItem Response Theory is not a reporting feature — it’s a way of deciding what a score is allowed to mean. Here’s the working translation for product teams.
BKT is four numbers and a strong assumption. Used honestly it’s a discipline for accumulating belief; used carelessly it launders guessing into certainty.
What a “mastered” cell is allowed to mean — and the evidence that licenses the claim.
Translating measurement and learning science into product decisions that survive a classroom.
Item Response Theory, Bayesian Knowledge Tracing, and educational data mining, kept honest.
Curriculum, assessment design, and the unit as an argument rather than a checklist.
Where AI serves the argument in a unit instead of the novelty — including work shown at ISTELive 25.